Replacing Clipboards with Code: How I Built a Counting Dashboard for Our Farm
The Quick Version:
Hand writing every order each week, then manually calculating totals started to feel unnecessarily time consuming. So I vibe-coded a permanent fix for less than $20.
As I’ve mentioned already, one of the very first jobs I learned on our farm was counting fish.
It sounds simple enough, but like a lot of farm processes, documenting weekly orders had grown into a routine that “worked” mostly because everyone was used to it. Every week started with a stack of blank sheets of paper. At the top, we’d write the customer’s name. Under that, we’d hand write each item they ordered and the quantity they needed. At the bottom, we’d total up the number of boxes for that customer.
As fish were counted during the week, we’d highlight each line item. By the time the fish were loaded into the truck, every line on every page would be highlighted.
It got the job done. But it was also a perfect example of a process that had never been revisited. And once I really thought about it, I started seeing cracks.
Paper and Water Don’t Mix
We depended on paper. Not even normal paper, either. We’d dig documents out of the trash pile, cut them in half with a paper cutter, and use those as our count sheets. On more than one Monday, I’d go looking for a stack and realize nobody had cut any. Eventually I got tired of scavenging and just started buying pre-cut paper on Amazon.
Then there was the marker problem. Somehow, permanent markers disappear around here like socks in a dryer. I am convinced there’s a gnome stealing them overnight.
And of course, this is a wet environment. Paper gets soggy. Highlighters get wet. Clipboards get messy. More than once, I handed my wife a set of damp, wrinkled count sheets so she could generate invoices, and she had to piece together the information from a stack of borderline destroyed papers.
From Farm Clipboard to Custom Dashboard
A few weeks ago, I watched a demo of Perplexity’s Computer feature, and an idea stuck with me: build a new clipboard system that eliminates the frustration and mental load of the old one.
So I sat down and vibe-coded what I wanted to build: a simple dashboard that could house our weekly orders and automatically do all the math.
The first version it gave me was promising, but it was nowhere near ready for real farm use. So I started giving feedback. It updated the tool. I tested it again. More feedback. More revisions. We probably went back and forth five or six times in a single evening before I had something that felt like a decent alpha version.
That same night, I uploaded the file to my web server so I could open it from our dedicated farm tablet. That tablet already had a job on the farm anyway. It plays music, lives in a waterproof case, and works well as a dedicated shared device. I like keeping my phone in my pocket, so having a separate screen I can leave in one spot while I move around is much more practical.
The next day, I put the dashboard to work.
Testing It in the Real World
Using software at a desk is one thing. Using it on a working farm is an entirely different experience.
The Alpha Test
On day one, I used the dashboard on the tablet while counting fish. By the end of the day, I could already see how much easier it was to tell what was left before packing day. But just as important, I could also see what needed improvement.
Throughout the day, I logged ideas and friction points using my AI field notes setup. That evening, I sat down with those notes and jumped back into another vibe-coding session. A few more changes later, my beta version was ready.
The Beta Test
The next day was packing day, which is where any weak system gets exposed fast. Fortunately, this was the day the counting dashboard proved itself.
It kept everything organized. It reduced the mental load (a lot) by allowing me to avoid manually calculating fish totals and box counts. It gave me a much clearer picture of where we stood as we packed orders.
There were still a few things to improve in this beta version, which were again logged using my field notes system. But now we were simply refining something that already proved itself to be useful.
After packing was done, I cleaned up, reviewed my notes, made one more round of changes, and ended up with a version of the dashboard that felt genuinely polished.
From initial idea to final working tool, the whole thing took about 72 hours and roughly $20 in credits to build. That still blows my mind.
A Tour of the Dashboard
What I like most about this tool is that it matches the rhythm of the actual work.
The entire dashboard lives on a single page, and the experience is fully vertical. At the beginning of the week, we start at the top. As orders come in and work progresses, we move further down the page. By packing day, we’re operating near the bottom. It creates a natural flow that mirrors the week itself.
There’s also a sticky navigation bar, which makes it easy to jump around quickly without scrolling. And because this is being used both indoors and outside, I added light mode and dark mode. I generally prefer dark mode, but in bright daylight the light theme is a lot easier to read on the tablet.
How It Works
Everything starts on Monday with inventory estimates.
Our farm sells four main types of corydoras: albino, green, paleatus, and panda. At the start of the week, I enter my estimated available quantity for each type and save it. That gives us the inventory picture we need before sending availability to customers.
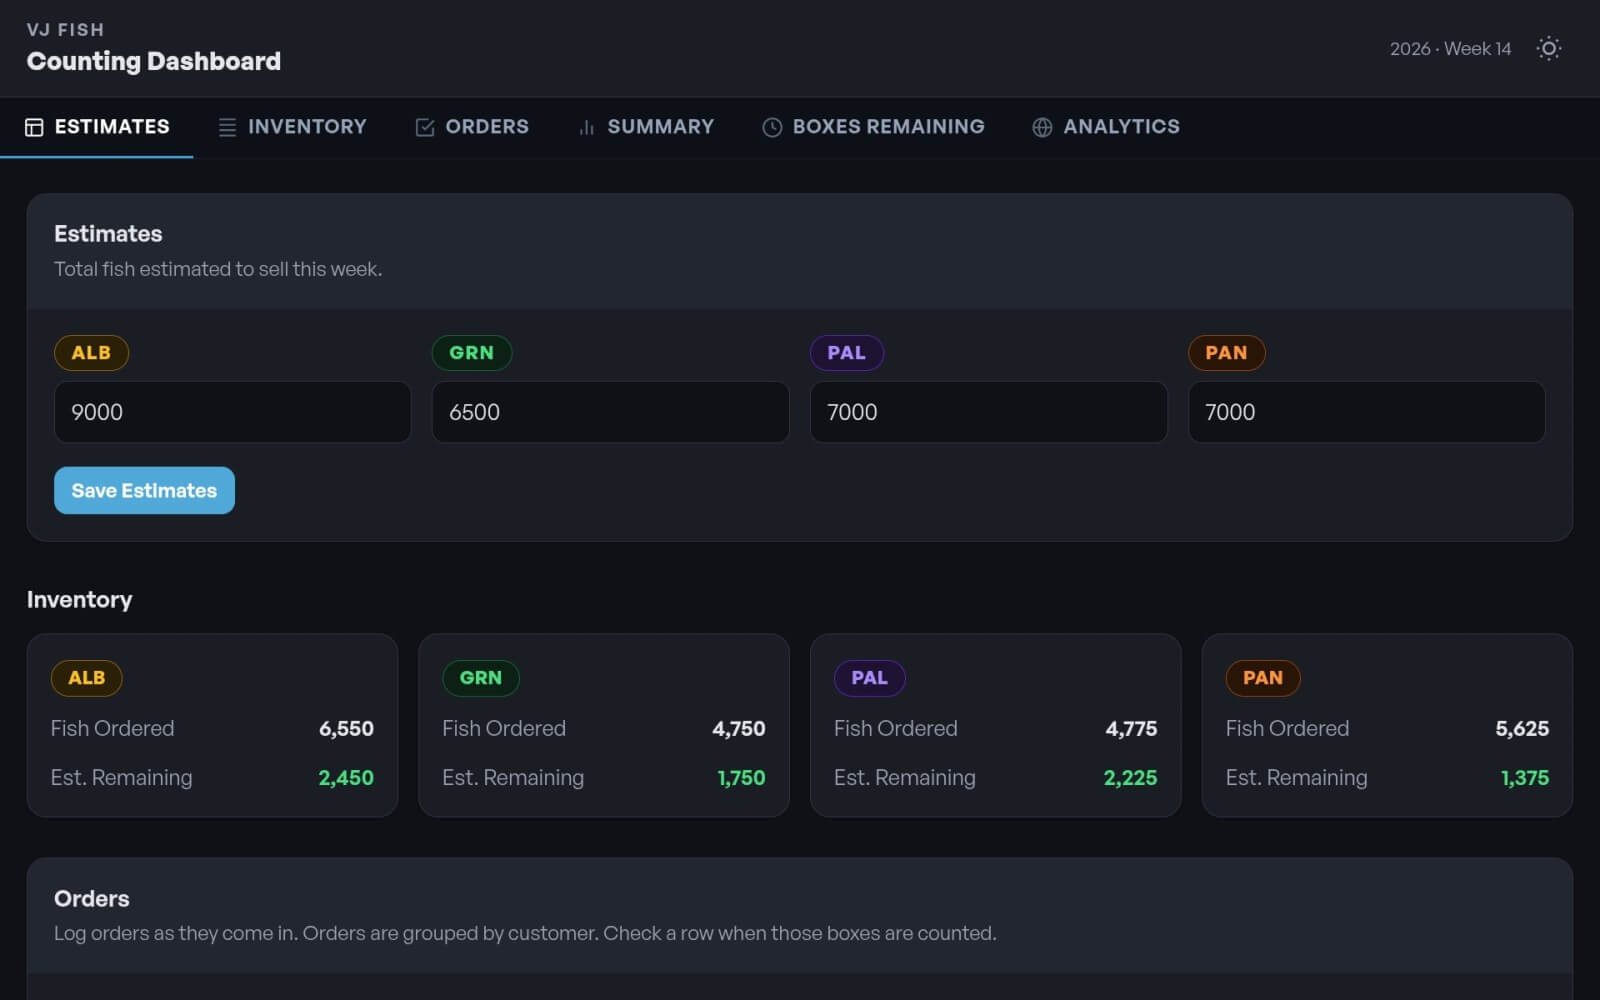
Once availability goes out, orders start coming in.
From there, I scroll to the Orders section, enter the details, and tap Add Order. That’s where the dashboard starts doing the work the clipboard never could. As soon as an order is entered, numbers update automatically across the page. Inventory adjusts. Totals shift. The whole thing stays live and connected.
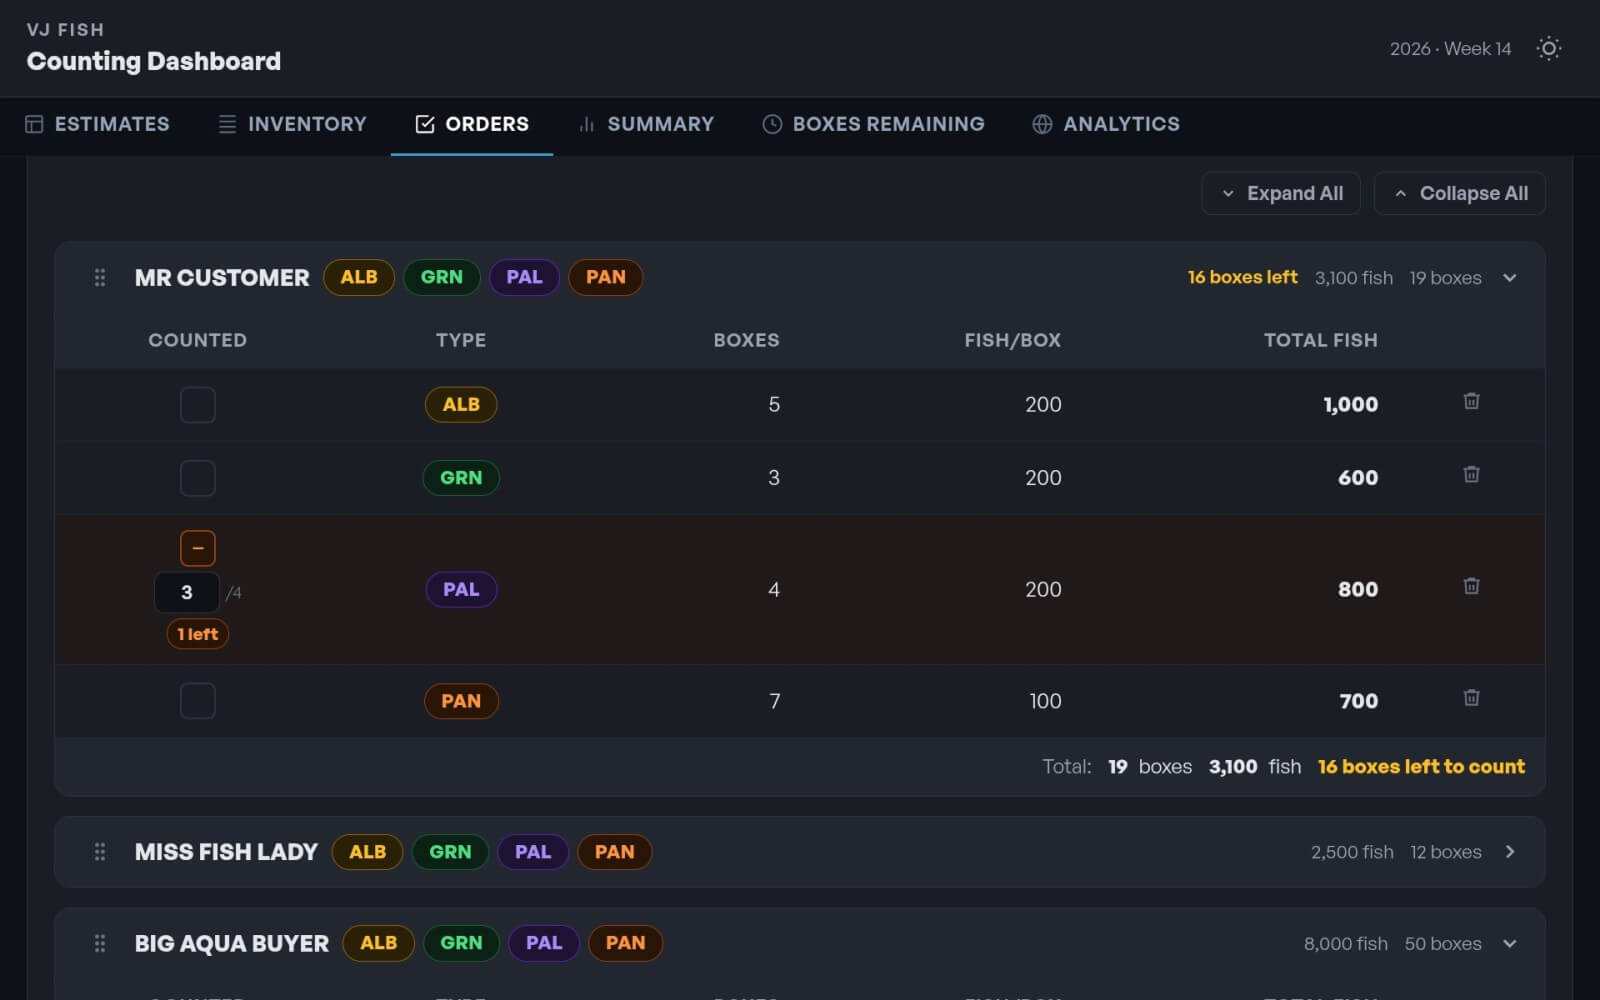
As the week goes on, we count fish and mark them off directly in the dashboard.
By the time packing day arrives, I can instantly see what has already been counted and what still needs attention. That alone removes a ton of guesswork.
We also pack orders in a specific sequence based on the delivery route, which changes from week to week. So I built in drag-and-drop sorting for customers. That lets us reorder each stop based on how the truck will actually be loaded and unloaded.
Then there’s the Summary section, which is probably the most useful part on packing day.
It shows exactly what’s left to count to complete all open orders. It identifies how many boxes are still needed, which fish still need to be counted, and how close we are to completion with a progress bar that gives a quick visual snapshot. On a hectic packing day, that kind of clarity is huge.
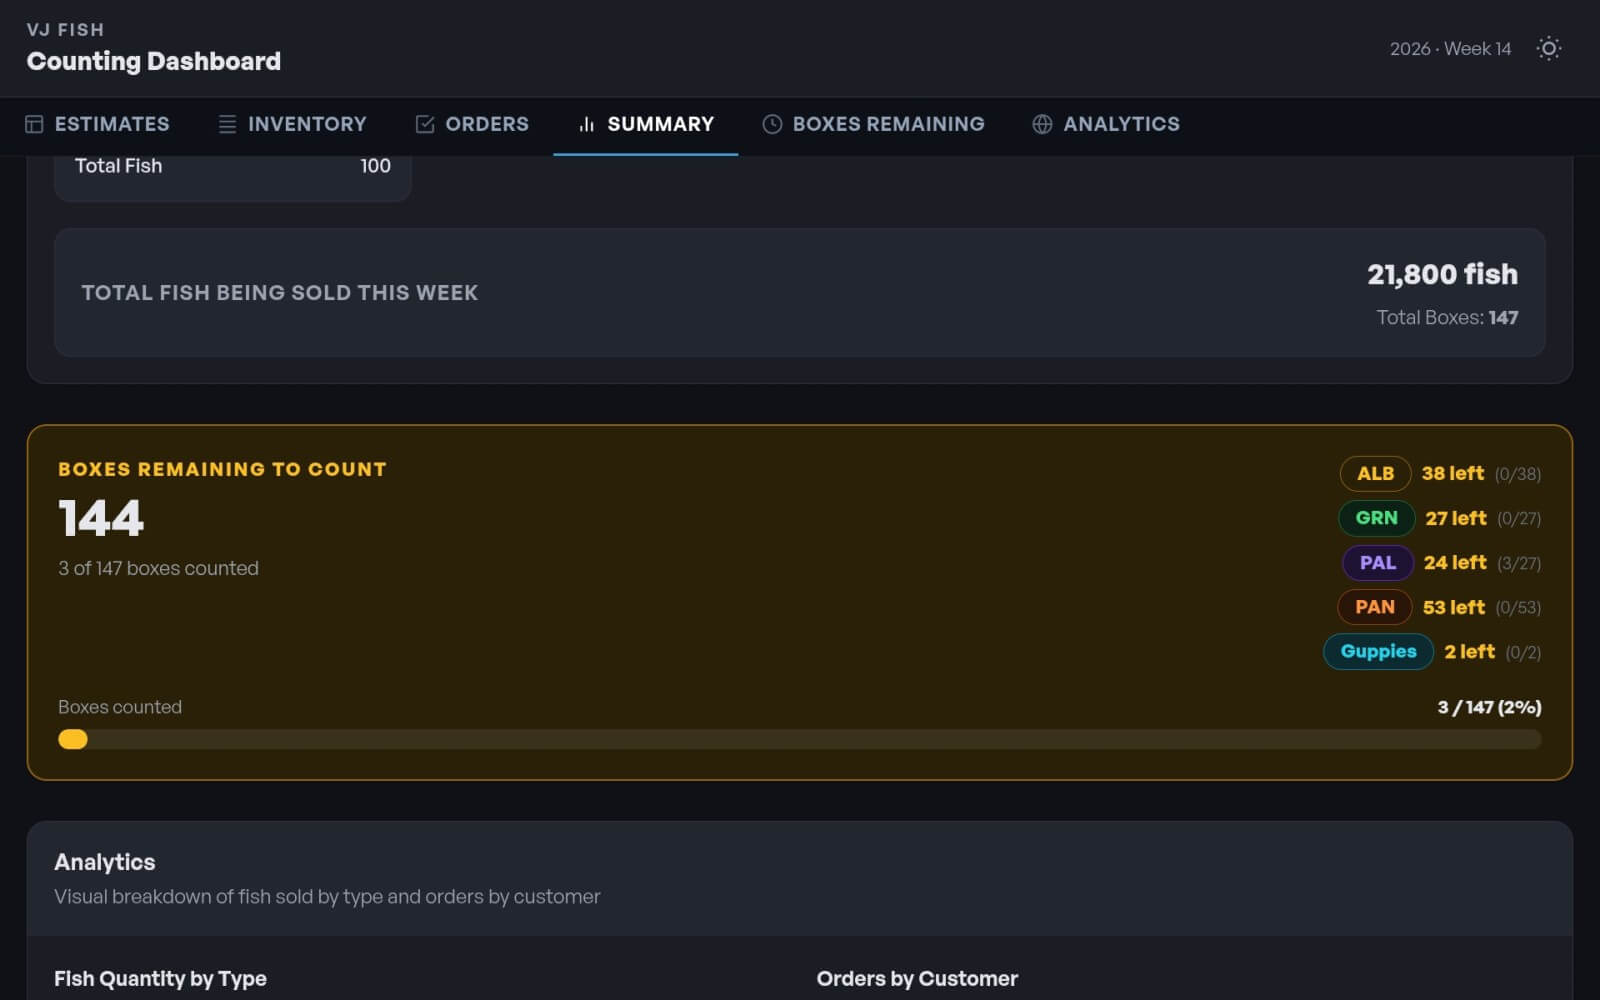
When everything is counted and boxed up, the dashboard gives us the green light. At that point, the fish are ready to go.
The Part a Clipboard Could Never Do
One of the biggest advantages of moving this process into software is that it doesn’t just track activity. It creates insight.
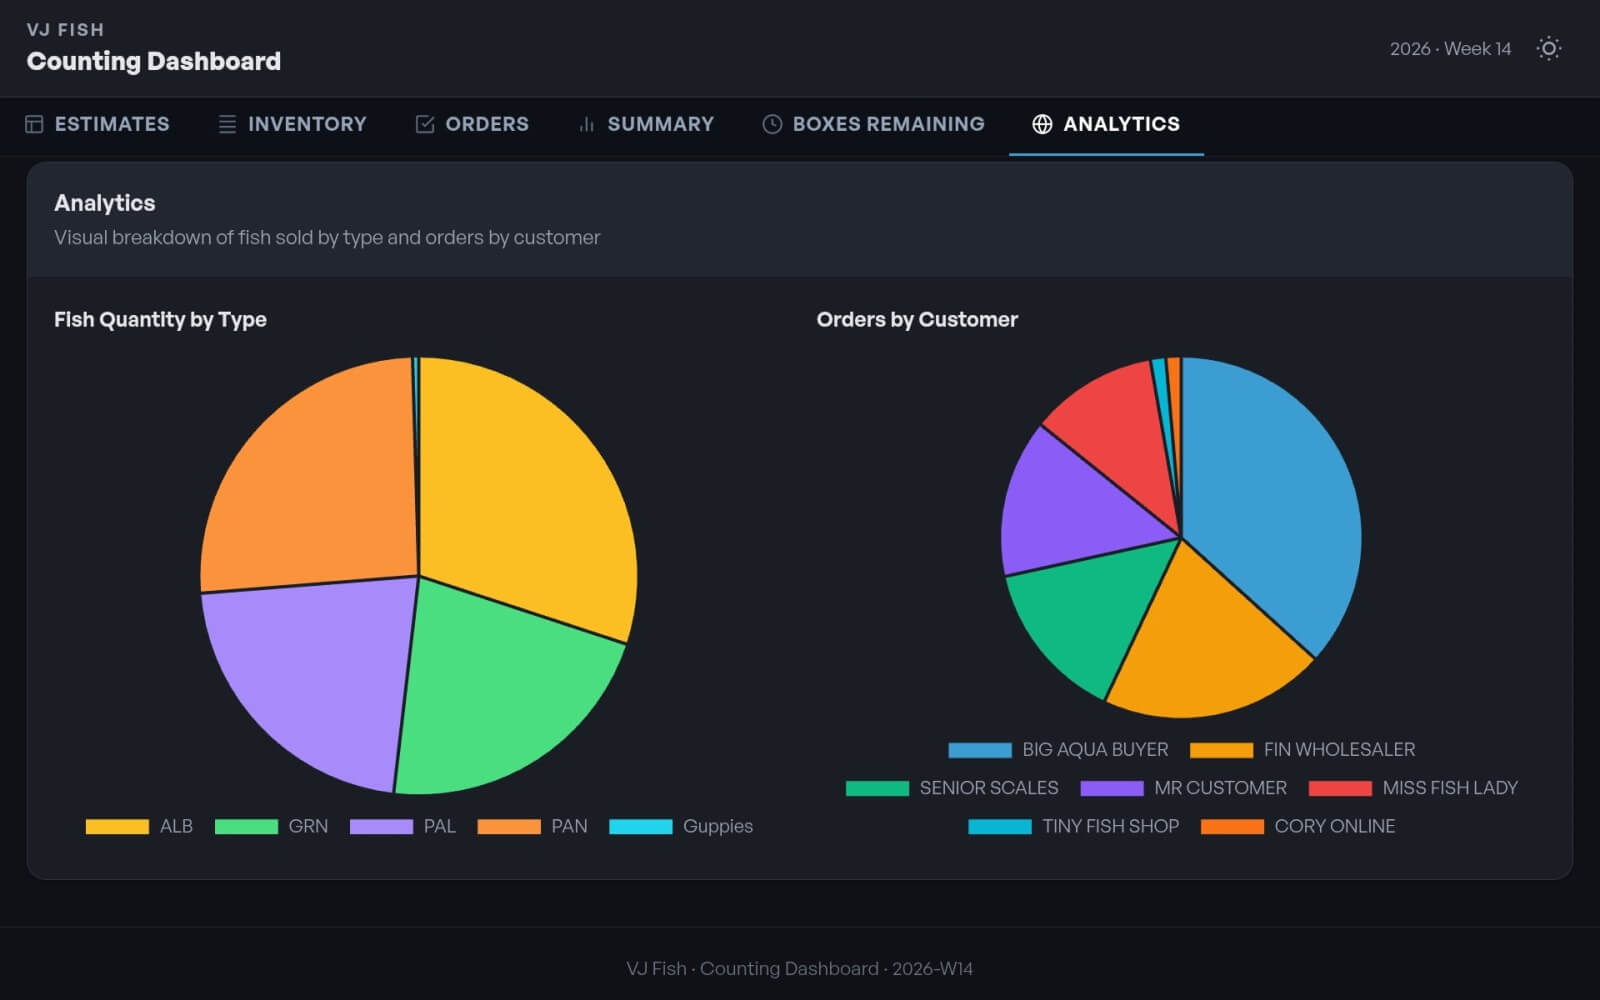
At the end of the week, once orders are finalized, I can use the Analytics section to see demand patterns visually. I can quickly spot which fish were in highest demand and how orders were distributed across customers.
That gives me two advantages right away.
First, I can see who’s taking the biggest slice of the pie. Second, I get a much better idea of what I need to stock up on for the next week.
A handwritten clipboard can tell you what happened. A dashboard can help you decide what to do next. That difference matters.
Why This Project Matters to Me
This wasn’t about building flashy software for the sake of it. It was about making a real operational improvement with a simple, practical tool.
By replacing our paper-based workflow with a custom dashboard, I eliminated ink, paper, wet clipboards, and a lot of manual math. More importantly, I created a system that helps me and my team stay organized in real time, prepare for the busiest day of the week, and make better decisions about customer demand for future planning.
That’s the kind of technology I care about most. Not tech for show. Tech that quietly removes friction, makes work easier, and helps a business run better.
In this case, code replaced the clipboard. And truth be told, I don’t miss the highlighters one bit.
Want to take it for a spin? Here’s the final version.
Wanna keep reading?